
Measuring and analysing your mobile app’s performance will provide valuable insights that form the basis for strategies to maximise your app’s future growth and success. The data collection and evaluation process is crucial, even for apps in the MVP stage.
Your mobile app should be consistently improving its performance and therefore increasing its value to users. Regular reporting and analysis are essential to understanding your users’ pain points as well as the parts of your app that they love so you can increase user loyalty, attract new users and generate more revenue.
Not only this but monitoring KPIs can support the accurate valuation of your mobile app, which is helpful for attracting investors and pleasing shareholders.
What are mobile app KPIs?
KPI means ‘key performance indicator’, so essentially mobile app KPIs are the metrics used to determine the success of your mobile app.
KPIs can relate to several different aspects of a mobile app, including but not limited to:
- User experience
- Engagement
- Revenue and financial data
- Marketing
- App store optimisation
There are many different KPIs that can be tracked and measured and each will offer slightly different insights.
The key is finding the KPIs and metrics that provide you with the most value, depending on your app’s strengths and weaknesses and your overarching business goals.
General Mobile App KPIs
General mobile app KPIs are ones that a majority of app development or marketing teams will monitor, regardless of the app’s unique features or special qualities.
Mobile Downloads
Mobile downloads are probably the most obvious mobile app KPI to track, not only because it’s a clear way to gauge your app’s popularity amongst users but also because it forms the basis for many other KPIs.
User Growth Rate
Monitoring your user growth rate will help you ensure that you are attracting more users as time goes on and what any periods of accelerated growth can be attributed to.
You may find that your app’s user growth rate changes as a result of changes to the pricing structure, major bug fixes or the release of new features, for example.
User growth rate can be calculated with the following formula:
((Present – Past) / (Past)) X 100 = User Growth Rate
Installs
The installs KPI tracks the number of users who have installed your app. This is a good way to determine how appealing your app is to users, however, this doesn’t account for users who download the app but don’t complete the setup process so remember to keep this in mind.
Uninstalls
The uninstall KPI is pretty self-explanatory and measures the number of users that uninstall or delete your app. Whilst most users won’t provide you with a reason why they are installing your app, it could be attributed to a few different reasons, such as:
- Your app crashes frequently or lags
- Your app hasn’t been updated regularly and there is no new content for users
- The user has completed the game or there are no more levels of progression left (for mobile games)
You can combine data from the uninstall KPI with the dates certain changes were implemented within the app to understand user sentiment towards the change.
For example, you might notice a correlation between the number of uninstalls and the release of a new feature, a subscription price increase or a new, less user-friendly in-app advertising strategy.
Registrations
As mentioned above, just because a user downloads your app doesn’t mean they have completed the setup or registration process.
The amount of users that decide to register is a more accurate representation of how interested users are in your app.
With consent, you can also use the email addresses users sign up with to support your marketing efforts, marketing new features or other apps they may be interested in.
Subscriptions
The subscription KPI involves tracking not only the number of users who subscribe to updates or new content alerts after downloading the app but also the amount of time it takes them to subscribe after the point of download and the average subscription length.
This data can help you better understand your users’ behaviour and design strategies to improve various aspects of the app’s performance.
Crashes
The crashes KPI refers to the number of times your app closes suddenly whilst it’s being used.
Analysing the number of times an app crashes, the device that the crashes typically occur on and the point in the user process that these crashes happen can help you effectively plan updates and fixes that directly tackle them.
The most severe and frequently occurring crashes should be addressed first, followed by the smaller issues identified.
This is critical for improving the app’s overall performance, user experience and user retention rate.
Upgrades
Similar to the subscription KPI, the upgrade KPI measures the number of people who upgrade to a premium or paid version of your mobile app as well as the time it takes them to do this, after the point of download.
Within this area, you should also consider what percentage of your user base sticks with the free version compared to the percentage of users that opt for the upgraded version.
This will help you to ascertain how engaged users are with your app, how financially committed they are and how valuable users find your app – which is all useful information to have when valuing the mobile app.
User Experience and Mobile App Performance KPIs
User experience and mobile app performance KPIs are used for monitoring the speed and stable performance of your mobile app.
The following metrics and KPIs are important as poor app performance can cause users to uninstall your app – leading to a direct loss of revenue. So, ensuring that your app is performing to as high a standard as possible is always best practice.
App Speed or Load Time
App load time monitors the amount of time it takes for your app to be ready to use after it is initially launched by the user, as well as the time it takes for users to transition from one activity to another.
Mobile apps with high app load times are more likely to be abandoned or uninstalled as users expect fast load times as a given.
Devices
Analysing the different types of devices that your users access your app from can help you better understand your users and give them the best experience possible in relation to their device.
With device information, you can optimise your mobile app to meet each device users needs, which improves user experiences, drives user loyalty and improves revenue generation.
OS
The operating system metric looks at what proportion of your users’ devices run on Android versus iOS. When combined with crash data, these metrics can help you identify any OS-specific problems and devise solutions to solve them.
Screen Dimensions/Resolution
Identifying the most popular screen dimensions and resolutions occurring across users’ devices can help you take a more focused approach to the quality assurance process, especially when combined with mobile app performance metrics like uninstalls or crashes.
API Latency
API latency monitors the amount of time it takes for your app to request and receive a response from an API.
You want this KPI to be as low as possible so that it doesn’t negatively impact user experience or contribute significantly to the app’s overall speed.
The best practice for improving API latency in mobile apps is to consistently dedicate time to it whilst ensuring that it works across all OS versions.
Network Errors
Network errors are the service provider and HTTP errors that occur when an app is attempting to connect to a network.
Although every network error cannot be prevented, it’s important to efficiently tackle them when they do occur and ensure that the user is informed of the situation.
A good way to prevent network errors is to prioritise good caching so that users don’t have to depend entirely on the network system.
App Load Per Period
App load per period refers to how well your app deals with multiple actions or events all at once. It basically tests whether your app can multi-task under pressure by completing actions in rapid succession in an attempt to overload it.
This ensures that your app doesn’t have trouble with users who are a little impatient and may try to tap a button multiple times to get it to load faster.
Permissions Granted
The permissions granted metric monitors the level of access or the number of permissions your app is granted by users.
Mobile App Engagement Analytics and KPIs
Mobile app engagement analytics and KPIs largely monitor user engagement habits including how, when and where they engage with the app.
There’s a direct correlation between your engagement rates and the revenue generated by the mobile app, so it’s important to monitor and analyse these KPIs regularly.
Retention Rate
The retention rate KPI shows you how many users return to your app after the first use, which can help you monitor how interested users are in your app, beyond initial curiosity.
As your app continues to grow and develop, your retention rate should improve month-on-month.
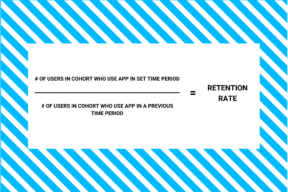
Retention rate can be calculated with the following formula:
Number of Users in Cohort Who Use App in Set Time Period / Number of Users in Cohort Who Used App in a Previous Time Period = Retention Rate
Sessions
Sessions refer to the number of times a user opens your mobile app. Each time the app is opened it counts as a new session.
Depending on the desired interactions you want your users to have with the app each time they open it, you may define a session differently. For example, for a game app you might consider a session to begin when the user actually starts playing – not just when the app is opened.
Typically, the more sessions, the better as this is a clear indication of a popular app.
Session Intervals
The session intervals metric looks at the number of time users leave between each session. Ideally, you want the data to show short intervals as this denotes that users aren’t waiting long before they jump back onto your app.
Apps that give users a reason to make interacting with the app a part of their daily routine tends to experience improved session interval data.
This can be achieved with a few different tricks:
- Contextual push notifications
- Email marketing for new updates, features or discounts
- Limited time offers or features
Session Length
Session length measures the amount of time users spend on your app, each session.
Usually, a longer session length is preferable, however, if your app doesn’t require users to stay on the app for a long period to convert or complete the desired action, session length might not be the most useful KPI to monitor.
In this case, consider tracking session depth instead.
Session Depth
The session depth metric tracks how far a user goes along the user journey before closing the app, or the number of interactions the user has per session.
Analysing session depth data can help you identify users’ pain points within the journey or if any technical issues are stopping the user from being able to complete the journey.
Average Screens per Visit
Average screens per visit measures the average number of unique screens that each user looks at during each session.
Typically, a high number of average screens per visit is desirable, especially if your mobile app monetisation strategy involves in-app advertising. The more screens a user visits, the more likely they are to view any ads you have running.
Daily and Monthly Active Users
Active users refers to the users who regularly open your app and interact with it, you typically want to see this number steadily increasing each month.
You can improve the number of daily (DAU) and monthly (MAU) active users on a mobile app using push notifications or by revisiting your marketing strategy.
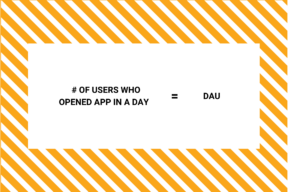
Daily Sessions can be calculated with the following formula:
Number of Users Who Opened the App in a Day = Daily Active Users
Number of Users Who Opened the App in a Month = Monthly Active Users
Daily Sessions per Daily Active User
Daily sessions per DAU measures how many times per day your users are using your app, which can provide insight into how much value your app adds to users daily lives and whether they are returning to your app as frequently as you want them to be.
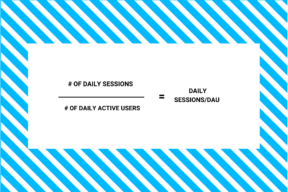
Daily Sessions per DAU can be calculated with the following formula:
Daily Sessions / Daily Active Users = Daily Sessions per Daily Active User
Stickiness
Stickiness refers to how frequently users are returning to your app. You can improve the ‘stickiness of your app by implementing push notifications, adding regular updates and refreshing your app’s content often.
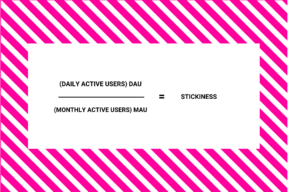
Stickiness can be calculated with the following formula:
(Daily Active Users) DAU / (Monthly Active Users) MAU = Stickiness
Churn Rate
The churn rate metric shows the number of active users that are choosing to uninstall your app after using it a few times.
You want to aim for this number to be as low as possible, however, a high churn rate can signify a few different issues to solve such as:
- The app crashes frequently or lags
- Users haven’t seen any updates or new content
- The user has reached the highest level of achievement (for game or gamified apps)
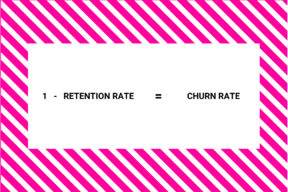
Churn rate can be calculated with the following formula:
1 – Retention Rate = Churn Rate
Social Shares
The frequency and sentiment of social media posts that share or discuss your app can help you understand how users really feel about it.
At a top-level, the more social shares, the better. However, it’s important to take into account the context of the shares especially if you notice a spike after a new feature or update has been rolled out.
On the surface, a spike in shares would look like a good thing in this scenario but you should always analyse the sentiment of your users’ social media posts – as they could all be complaining about the new update but you won’t know unless you look deeper.
Brand Awareness
When we talk about brand awareness, we are talking about how many times your app or brand is mentioned in search results, on social media or its overall reach.
Brand awareness drives downloads, engagement, conversions and eventually revenue so it’s worth keeping an eye on the brand awareness KPI and monitoring this for improvements.
Revenue KPIs and Financial Metrics
Revenue KPIs and financial metrics provide insight into the costs and profits involved with your app. This information is vital for investors and for supporting business growth.
Average Revenue per User (ARPU)
Average revenue per user refers to the average amount of income generated by each of your app’s users through app purchases, subscription fees, ad revenue etc.
The ARPU metric is important for app valuation, investor confidence and can serve as an indicator of whether revenue targets will be met.
It’s worth noting that outliers can heavily skew the data for mobile apps that don’t have a lot of users. For example, one or two users that spend an unusually large amount of money can impact the accuracy of the average revenue figure.
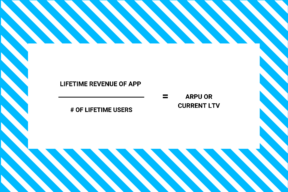
User growth rate can be calculated with the following formula:
Lifetime App Revenue / Number of Lifetime App Users = Average Revenue Per Customer
Purchases
The purchases metric measures the number of purchases that users have made through your app. Development teams and mobile app marketers should aim for this figure to increase over time.
If the number of purchases begins to decrease, it’s worth considering why this might be and how you can encourage more purchases. Try redesigning the user journey or offering more relevant offers and promotions.
This metric is also useful if you have a website, as you can compare the figures to identify which channel more purchases are made through.
Time to First Purchase
Time to first purchase looks at how long it takes for users to make their first purchase on your app – this is highly applicable to eCommerce apps and other apps that involve customers paying for goods and services.
There’s no set goal or definitive ‘good’ figure for this metric as purchase times will vary from industry to industry. Therefore, it’s best to benchmark yourself upon past performance or other similar market competitors.
If the time to first purchase is longer than you’d like, try shortening the path to checkout to make it quicker and easier for users to make their first purchase.
User Lifetime Value (LTV)
User lifetime value is the total amount of revenue a user has brought to you from the first time they use your app to the last time they use it.
LTV takes into account the frequency of users’ transactions, the average transaction value and how long users continue to use the app.
User lifetime value is useful for predicting how much value you can get out of each user, potential revenue and the app’s overall value.
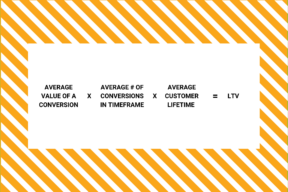
Lifetime Value can be calculated with the following formula:
Average Conversion Value X Average Number of Conversions in Timeframe X Average Customer Lifetime = Lifetime Value (LTV)
Conversion Rate
An app’s conversion rate is the percentage of users who complete a desired action on the app.
For e-commerce apps, the desired action could be a completed purchase but for a game app this could be when a user begins playing the game, so it varies between different markets and niches.
Whilst overall conversion rates are still a useful metric to track, it can be beneficial to track paid and organic conversions separately to accurately measure the value of paid advertising spend.
Paid conversion rate is: The percentage of users who are converted via paid advertising methods such as PPC advertising or sponsored or promoted social posts.
Organic conversion rate is: The percentage of users who are converted via unpaid methods such as word of mouth, PR and social media mentions. This metric includes conversions for any marketing method that doesn’t involve paid advertising.
To improve mobile app conversion rates, try:
- Creating personalised offers
- Improve CTA button visibility
- Ensure every action in the app leads directly to users taking the desired action
Cost Per Acquisition (CPA)
Cost per install (or CP) refers to how much you have to spend to acquire one user to your app. CP monitors paid acquisitions, rather than organic ones.
It’s also worth looking at the marketing channels that bring you the most customers and adapt your marketing spend accordingly.
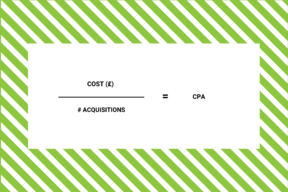
Cost Per Acquisition can be calculated with the following formula:
Cost / Number of Acquisitions = CPA
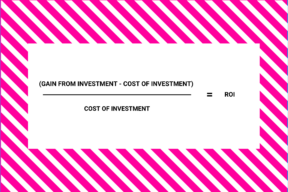
Return on Investment (ROI)
Return on investment or ROI is a financial metric used to evaluate the efficiency of your mobile app growth strategies and techniques, this should include expenses as well as time.
Return on investment can be calculated using the following formula:
(Gain from Investment – Cost of Investment) / Cost of Investment = Return on Investment (ROI)
Mobile App Marketing KPIs
Mobile app marketing KPIs help app marketing teams understand the effectiveness of their marketing strategies by identifying their strengths, weaknesses, opportunities and threats in a statistical and scientific way.
Install Source Attribution
Install source attribution monitors the platform that customers discover and subsequently download your app from.
The install source attribution metric is especially useful for evaluating the success of a marketing campaign as mobile app marketing teams can see specifically which marketing effort led to a user downloading your app.
Virality or Viralness
Virality and viralness refer to the word of mouth popularity experienced by your app.
One of the simplest methods of measuring the virality of your app is by calculating what is commonly referred to as the K factor.
K factor can be calculated using the following formula:
Number of Mentions X Conversion Rate = K Factor
It’s worth noting that there are a few other different ways to calculate a measurement of virality, it’s best to choose which method you’re going to use to calculate it and then stick with it so that your results can remain as accurate as possible, aiding comparisons over time.
Geo-metrics
Gro-metrics monitors the geographical locations of your user base as well as their languages.
Analysing geo-metric data can help you craft more targeted mobile app marketing campaigns, which appeal to and subsequently convert users within particular regions or locations that you want to expand into or where existing market share could potentially be increased.
Geo-metrics could also be used to influence any future mobile app localisation strategies.
Demographics
The demographics metric is fairly simple to understand, it measures the class, age, gender and ethnicity of your users or target audience.
Not only can user demographics give you a better understanding of how you can ensure your app is meeting the needs of its current users, but it can also help you assess the effectiveness of any targeted marketing strategies when analysed in comparison with the demographics of your target audience.
Cohort Analysis
Cohort analysis involves grouping your users into different categories (or cohorts) based on several criteria, including:
- Demographics
- Locations
- In-app behaviour
- Other defining characteristics
Cohort analysis can provide a wealth of information about your current and target user base, which can be used to support growth strategies.
Behavioural Metrics
Analysing your users’ behaviours can help you better understand your audience’s thought processes and uncover unique insight into their minds.
Behavioural metrics include how users found your app, the actions they take after downloading it, other apps they’ve downloaded, the social networks they use and much more.
Behavioural metrics can be utilised to tailor new feature development and marketing strategies to coincide with users’ interests and behaviours, improving their efficacy.
App Store Optimisation KPIs
App store optimisation KPIs give you valuable insight into how effectively your mobile app is being marketed and promoted to attract user downloads within app stores.
By analysing these metrics, strong app store optimisation strategies can be developed and implemented, which leads to a direct increase in app installs.
Keywords
Keywords are the specific words or phrases that led your user to be able to find and eventually download your app.
Always try to make sure the keywords you are using in your app name and listing information are accurate, used proportionately and are not misleading.
App Store Category Ranking
Your app will be sorted into a distinct category depending on its functionality and purpose. Pay attention to where your app is ranked within the category it exists within and how this changes over time.
As a rule of thumb, the better the category ranking, the better your app will perform.
Reviews
User reviews can provide constructive, qualitative feedback on every aspect of your app, from design to functionality to pricing.
An app that has lots of positive reviews tends to denote a highly engaged and loyal user base as not every user will make the time and effort to write a review.
The more reviews you have the better, as this will contribute to how many potential users trust your app to perform well and meet their expectations.
What mobile app metrics and KPIs are you monitoring?
Monitoring mobile app KPIs and performance metrics are critical for ensuring that your app is consistently improving, attracting more users and generating more revenue as time progresses.
To reiterate, not every single KPI and metric listed in this article will necessarily need to be tracked depending on your app’s functionality, audience and overall growth objectives, so be sure to consider which ones will provide you with the most value to avoid becoming overwhelmed.